
Markets Flying High in the West: Arizona and Texas
Published: 09/13/2021
Arizona and Texas are consistently the top markets for business expansions and relocations across a variety of industries and operations in the western U.S. In fact, software and IT employment in both Arizona and Texas grew by 27.2% from 2015-20. As the speed of business cycles intensify and markets experience more social, environmental and economic turbulence, it is important to review the most important facets of business operations. When you consider grid stability and redundancy, tax burden and employment growth, critical business considerations come to light.
Here is the tale of the tape when evaluating the top risk factors.
Power Disturbances
Power reliability is among the most important components to consider when selecting a market. Downtime equates to loss of money, and corporations lose millions of dollars when storms and other disasters prevent operations from taking place.
From 2015-2020, Texas had 140 hours of major power disturbances, while Arizona had less than seven, according to the U.S. Energy Information Administration.
Arizona had the second-most reliable power grid in the U.S. in 2019, according to U.S. News & World Report. Texas ranked 29th.
Natural Disasters
Based on weather and climate disasters from 1980-2020 that caused at least a billion dollars in damage, Texas suffered the most damage at $293.4 billion. Arizona’s costs were a fraction of that at $6.7 billion, which ranks 15th-best in the country.
State | Total Events | National Rank | Total Cost (Millions) | National Rank |
Texas | 124 | 1 | $293,365.0 | 1 |
Arizona | 26 | 38 | $6,762.9 | 36 |
Arizona vs. Texas Tax Burden
While Texas is known for its low tax rates, Arizona outranks the state for overall burden in all major operation types studied by the Tax Foundation. This study combined the burden of all possible taxes a business would pay in the state including corporate income, property, sales, unemployment insurance, capital stock, inventory and gross receipts.
The result: Arizona’s tax rates for both mature firms and new firms are more business-friendly than the tax burden of Texas in every industry the Tax Foundation reviewed.
Arizona and Texas Tax Burden
Firm Type | Arizona Mature Firm Rate | Texas Mature Firm Rate | Arizona New Firm Rate | Texas New Firm Rate |
Corporate Headquarters | 14.2% | 16.0% | 15.3% | 20% |
R&D Firm | 9.6% | 13.5% | 15.7% | 21.8% |
Technology Center | 8.8% | 12.7% | 18.1% | 24.5% |
Data Center | 3.0% | 11.6% | 12.1% | 24.4% |
Shared Services Center | 15.4% | 25.3% | 23.0% | 36.2% |
Distribution Center | 28.2% | 41.3% | 34.3% | 54.4% |
Capital-Intensive Manufacturer | 9.0% | 13.4% | 17.6% | 28.3% |
Labor-Intensive Manufacturer | 7.3% | 9.1% | 12.3% | 17.0% |
Source: Tax Foundation, “Location Matters 2021: The State Tax Costs of Doing Business”
Employment Growth
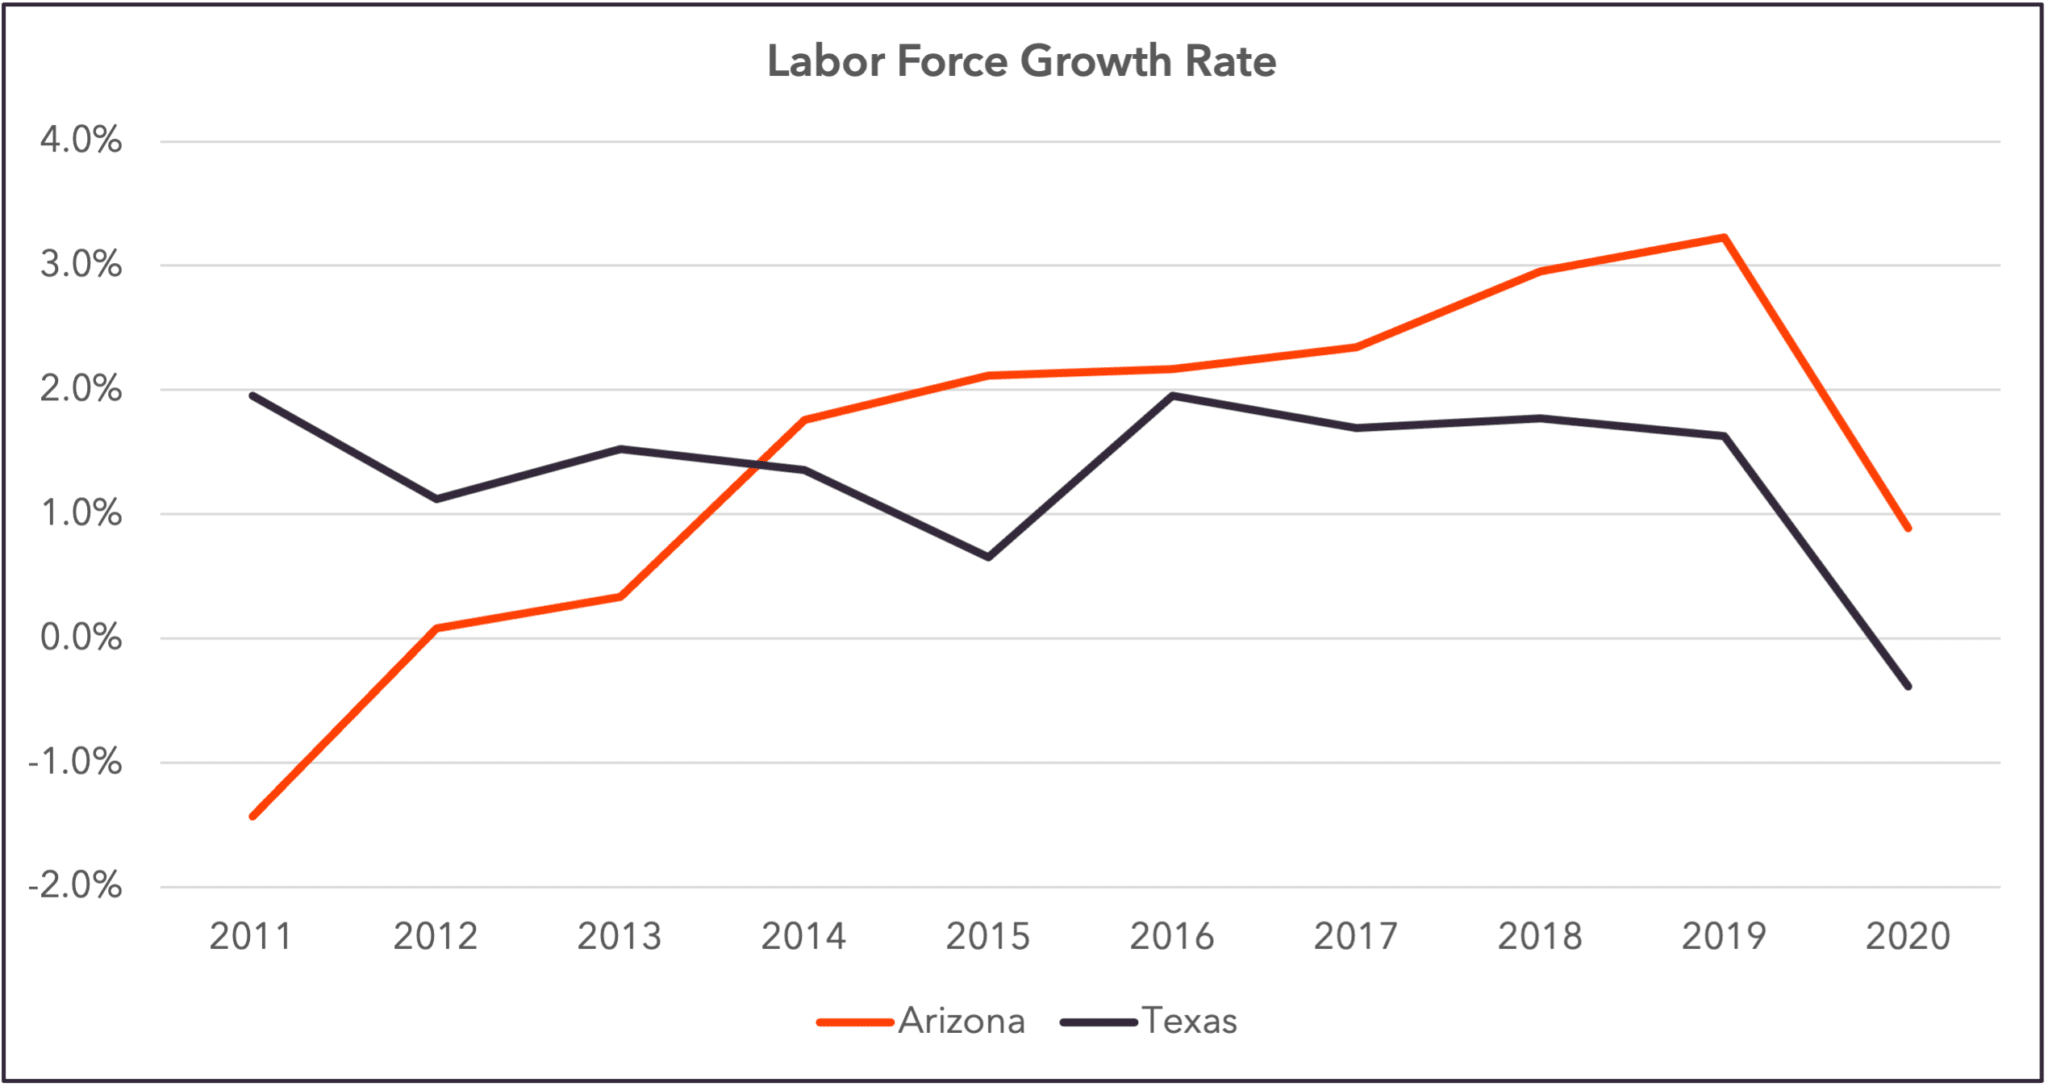
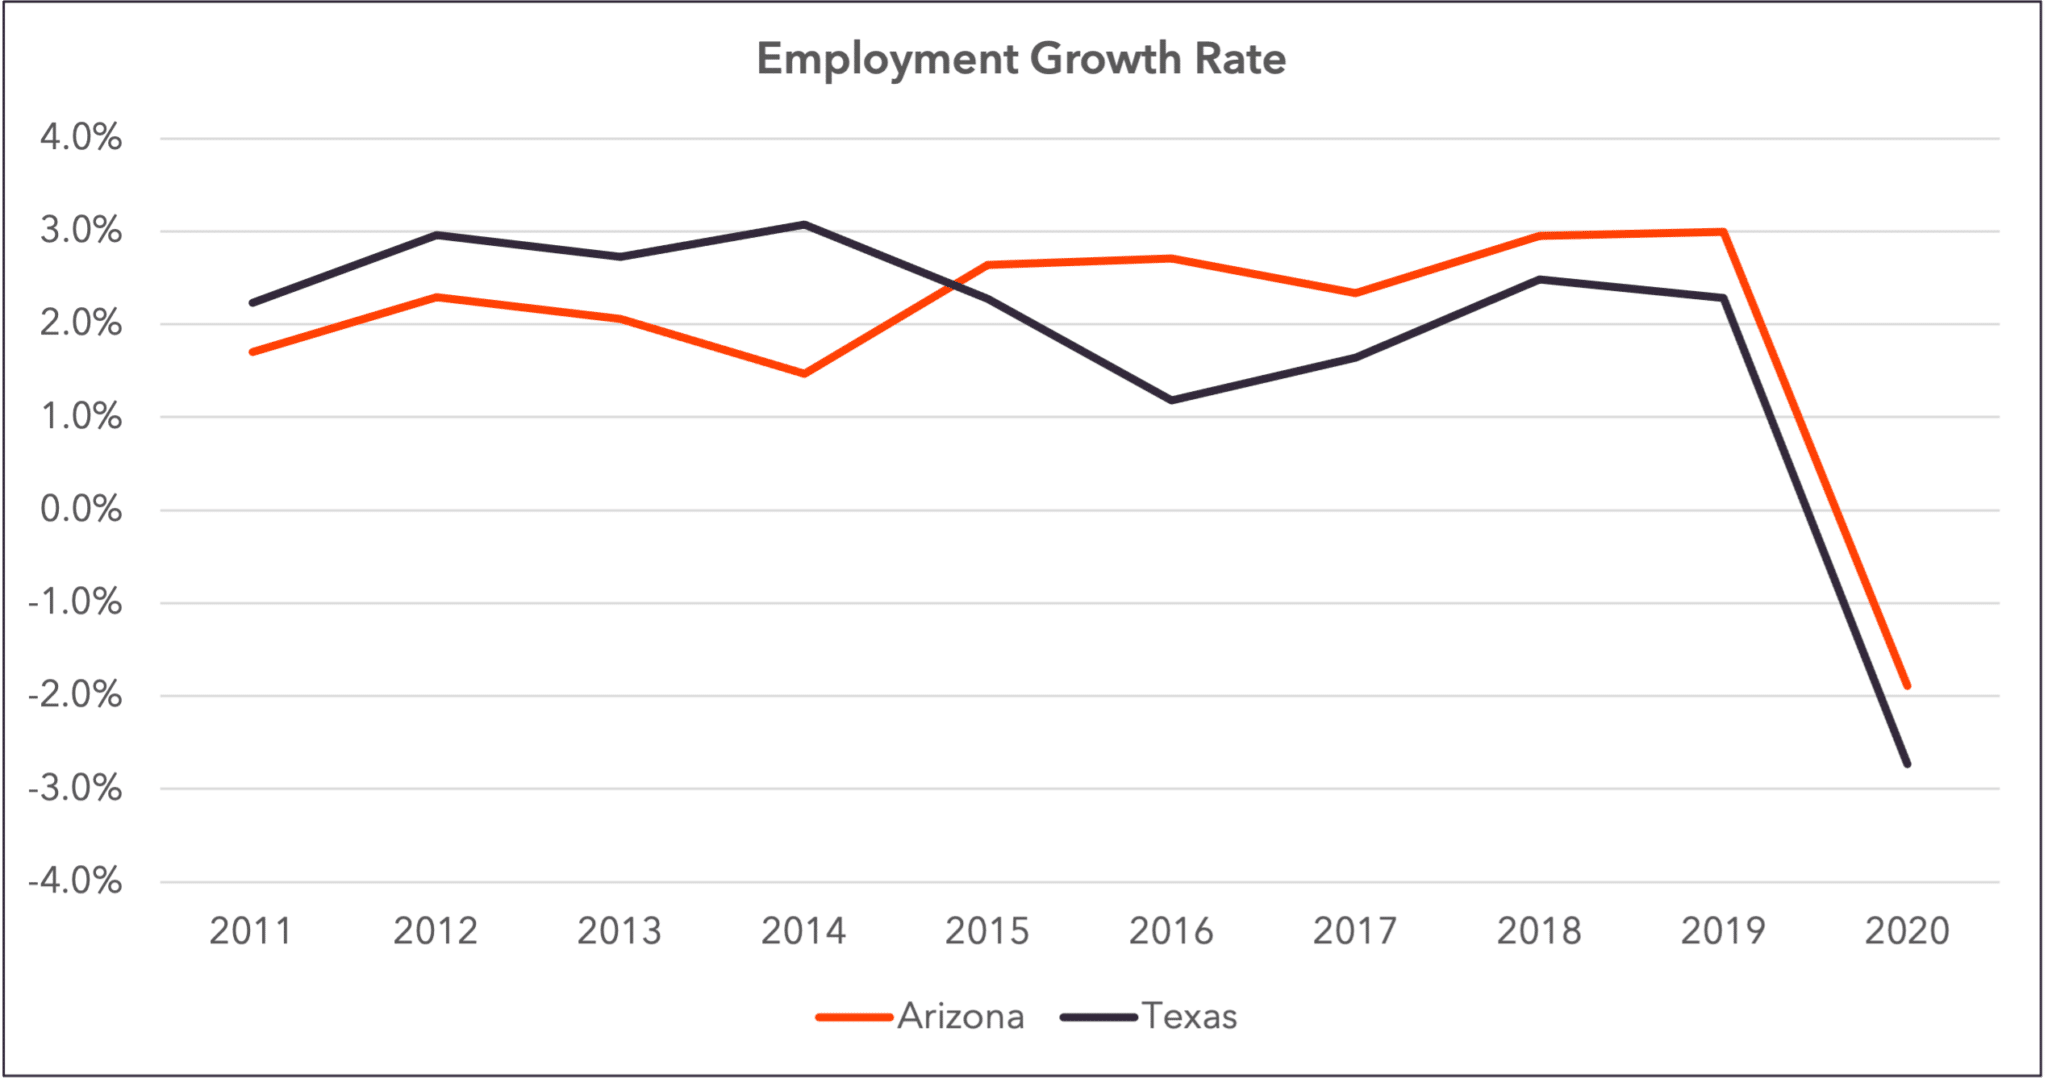
Greater Phoenix’s notable maturation isn’t a new phenomenon. Since 2014, Arizona has outpaced Texas in labor force growth, and since 2015, Arizona has outpaced Texas employment growth.
For companies looking to start, expand or relocate, Greater Phoenix offers a highly competitive workforce with the education infrastructure that builds a strong, knowledgeable and reliable candidate pipeline. Business leaders can capitalize on the overall number and quality of eligible candidates to fill positions within the company at every level. With an eager workforce waiting for new opportunities, top-quality talent can be found in Greater Phoenix.
Arizona has also seen higher growth in seven of Texas’ 10 fastest-growing occupation groups. Greater Phoenix has experienced tremendous business and population growth over the last decade, and unlike other major competing cities, city planners have developed the requisite infrastructure to support this influx of new companies and people. Both commercial and industrial industries will find adequate space and a talent pipeline to support future scaling within Greater Phoenix.
2010 – 2020 Employment Growth by Occupation
Occupation Group | Arizona | Texas |
Business and Financial Operations Occupations | 52.3% | 49.8% |
Computer and Mathematical Occupations | 54.9% | 47.5% |
Healthcare Support Occupations | 62.2% | 40.3% |
Transportation and Material Moving Occupations | 44.0% | 38.8% |
Healthcare Practitioners and Technical Occupations | 37.2% | 29.2% |
Community and Social Service Occupations | 30.8% | 22.3% |
Installation, Maintenance and Repair Occupations | 29.3% | 22.2% |
Source: Emsi 2021 Q2
AZ vs Texas: Which Location is Best for Your Business?
Data and the pro-business environment in Arizona put Greater Phoenix among the top markets to consider for expansion or relocation. When factoring in tax burden, power disturbances and natural disasters, your business will pay less in Arizona than in Texas. Arizona offers businesses reliability in all major areas — with a booming workforce and infrastructure designed for expansion, Greater Phoenix offers every industry the opportunity to thrive and scale.
Want a custom cost comparison to see how the Greater Phoenix market can help your business?
Learn more about companies moving to Arizona:

